English


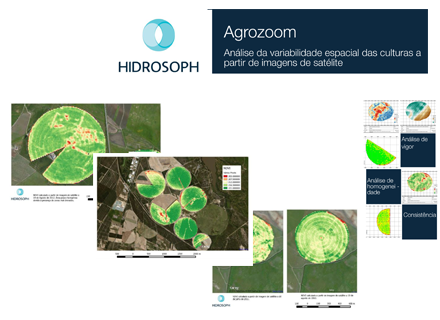
AgroZoom: NDVI Images
See up close and from a distance for great results.
The use of several devices to monitor the variables that influence agriculture (weather stations, capacitance probes, tensiometers, pressure chambers, etc.), is possible with the Irristrat™ platform, in a simple and integrated manner, providing farmers with the fundamental tools for obtaining optimal results. This equipment provides very accurate and valid information, but specific to the point where it is installed.
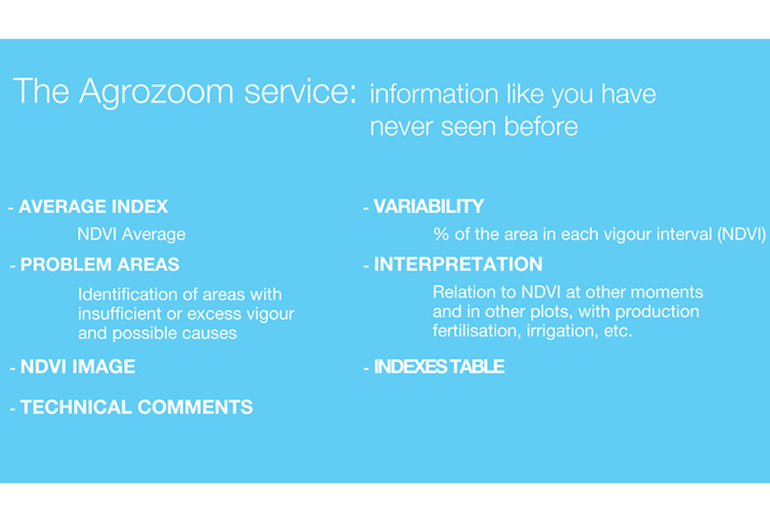
Through the use of aerial images and their combination with field information and readings recorded in Irristrat™, the Agrozoom service offers the farmer information about plant vigour, uniformity and consistency, increasing the reliability of data extrapolation in the crop areas.
Vigour Analysis
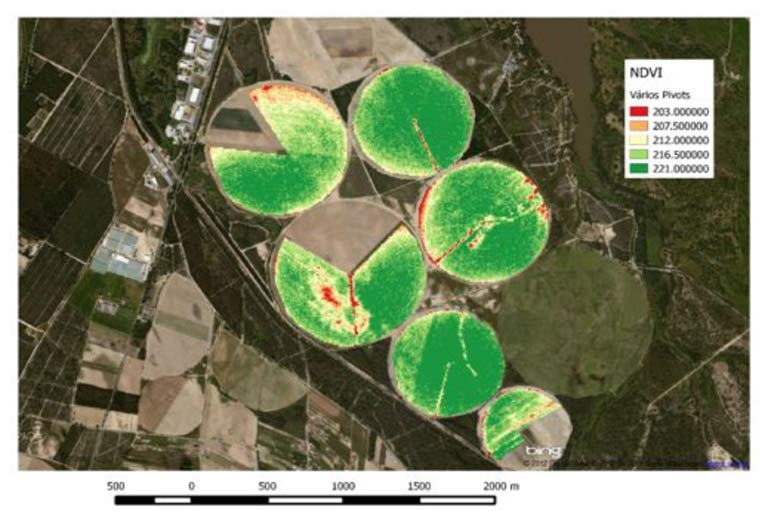
Through a sequence of digitally processed images classified according to a colour scale, the vigour of plant growth is analysed in the various plots. This analysis enables the identification of problem areas and assists in the identification of the causes (e.g. irrigation system, drainage, etc.).
• Analysis of the vigour of plant growth at a specific moment
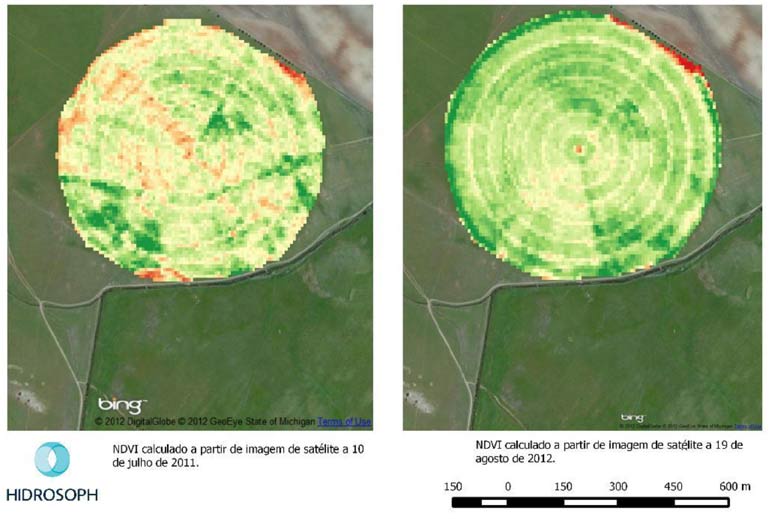
• Temporal comparison (several periods)
• Spatial comparison (several plots)
• Analysis of the Final production/Vigour ratio at the various growth stages
Homogeneity Analysis
The images allow for precise characterisation of the plots, identification of problem areas, definition of homogeneity levels and obtaining the representativeness of the monitoring points on the land.
Once this information is crossed-checked with the information on Irristrat™, the following can also be compared easily:
- Homogeneity of the plot
- Identification of problem areas
- Representativeness
Consistency
With the use of multiple images obtained during the same crop cycle, it is also possible to check if the deviations are consistent and if the crop progress is as expected for its cycle. In addition, it is also possible to analyse the impacts of in-depth interventions.
- Analysis of the vigour of plant growth at a particular moment
- Comparison with other moments and other plots
An irrigation example
Vigour
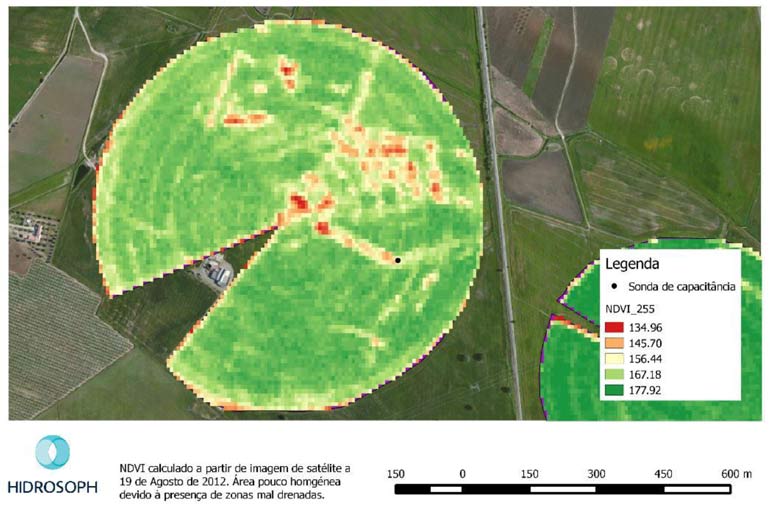
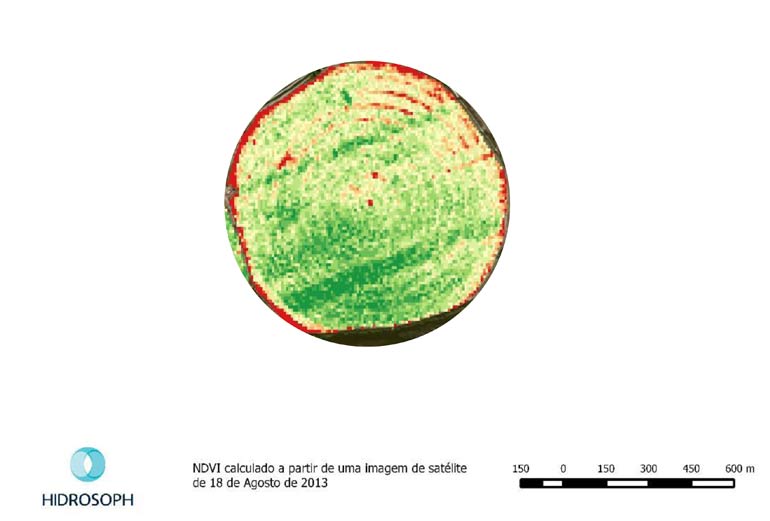
In this image, the spatial variability of the vigour of plant growth was represented in the form of a vegetation index map, calculated on the basis of the amount of reflected radiation: the NDVI (Normalised Difference Vegetation Index). Here it is possible to locate where the probe is installed and compare the value at that point with the rest of the plot.
Homogeneity
The crop area was represented with five colour levels, through the classification of the information on the image’s map. The higher this index (dark green), the greater the vigour of plant growth. In contrast, the lower the index (red), the lower the vigour.
Representativeness
The probe is situated on the fourth level, representing approximately 30% of the plot. Therefore, irrigation management can be done taking into account that 20% of the area is above the representativeness of the probe and the remaining 50% of the area is below.
Reasoned Decisions
With this interpretation of the areas’ statistics, we are also in possession of some very interesting elements for assessing the economic viability of some interventions that might be considered, in particular: drainage and the improvement of the irrigation and fertilisation system.